Data Normalization With Python Scikit-Learn: Tips & Tricks for Data Science
•6 min read
- Languages, frameworks, tools, and trends

Beginners to data science or machine learning often have questions about data normalization, why it’s needed, and how it works. Put simply, data normalization is a data preparation technique that is common in machine learning. Its goal is to transform features to similar scales (change the range of the values) to help improve the performance and training stability of a model.
Note that not every dataset needs to be normalized for machine learning; it’s only needed when the ranges of attributes are different.
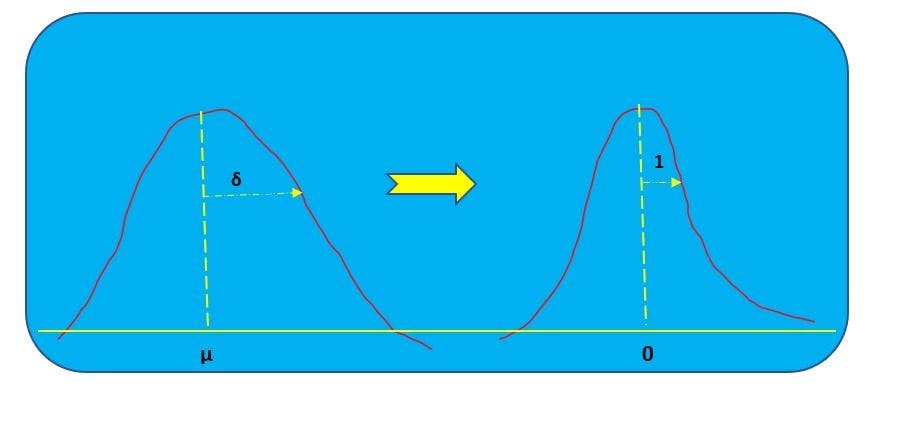
Image Source: Author
Here’s an example: there’s a dataset with two variables, height (cm) and weight (kg). The most obvious problem is that the variables are measured in different units: one in cm and the other in kg. This impacts the distribution. To solve the issue, normalization is used to transform the data in such a way that either is dimensionless or has similar distributions. This process of normalization is known by other names such as feature scaling, standardization, etc.
This article will discuss the various data normalization techniques used in machine learning and why they’re employed.
Why normalization is needed prior to model fitting
Data normalization is useful for feature scaling while scaling itself is necessary in machine learning algorithms. This is because certain algorithms are sensitive to scaling. Let’s look at it in more detail.
Distance algorithms like KNN, K-means, and SVM use distances between data points to determine their similarity. They’re most affected by a range of features. Machine learning algorithms like linear regression and logistic regression use gradient descent for optimization techniques that require data to be scaled. Having similar scale features can help the gradient descent converge more quickly towards the minima. On the other hand, tree-based algorithms are not sensitive to the scale of the features. This is because a decision tree only splits a node based on a single feature, and this split is not influenced by other features.
What is Python scikit-learn?
Scikit-learn, also known as sklearn, was part of the Google Summer of Code (GSoC) project. It was first developed by David Cournapeau in 2007 and publicly released in 2010. It’s an open-source and easy-to-use library that simplifies the task of coding and assists programmers with visualization. It mainly helps with focusing on modeling and not on loading data.
Advantages of Python scikit-learn
- The Scikit-learn library is a handy tool that helps with predictions and visualizations.
- It provides API documentation for users who want to integrate algorithms with their platform.
- The library is spread under the BSD (Berkeley Software Distribution) license. This makes it free with minimal legal and licensing restrictions. Users can employ it without hesitation and run it on their platform.
Normalization techniques in machine learning
The most widely used types of normalization techniques in machine learning are:
- Min-max
- Z-score
- Log scaling
In order to implement the above techniques, the following functions are used to achieve functionality:
- The fit(data): This method helps compute the mean and std dev for a given feature, which assists in further scaling.
- The transform(data): This supports performing scaling using mean and std dev calculated using the .fit() method.
- The fit_transform(): This method performs both fit and transform.
Min-max scaling
Min-max is a scaling technique where values are rescaled and shifted so that they range between 0 and 1 or between -1 and 1.
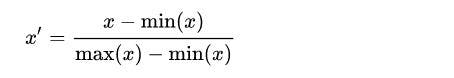
where x is a raw value, x' is the normalized value, min is the smallest value in the column, and max is the largest value.
Example:
There are five numeric values: 14, 9, 24, 39, 60.
Here, min = 9 and max = 60. Therefore, the min-max normalized values are:
9: (9 - 9) / (60 - 9) = 0 / 51= 0.00
14: (14 - 9) / (60 - 9) = 5 / 51 = 0.098
24: (24 -9) / (60 - 9) =15 / 51 = 0.29
39: (39 - 9) / (60 - 9) = 30 / 51 = 0.58
60: (60 -9) / (60 - 9) = 51 / 51 = 1.00
Min-max normalization gives the values between 0.0 and 1.0. In the above problems, the smallest value is normalized to 0.0 and the largest value is normalized to 1.0. sklearn. preprocessing.MinMaxScaler library is used to implement min-max normalization.
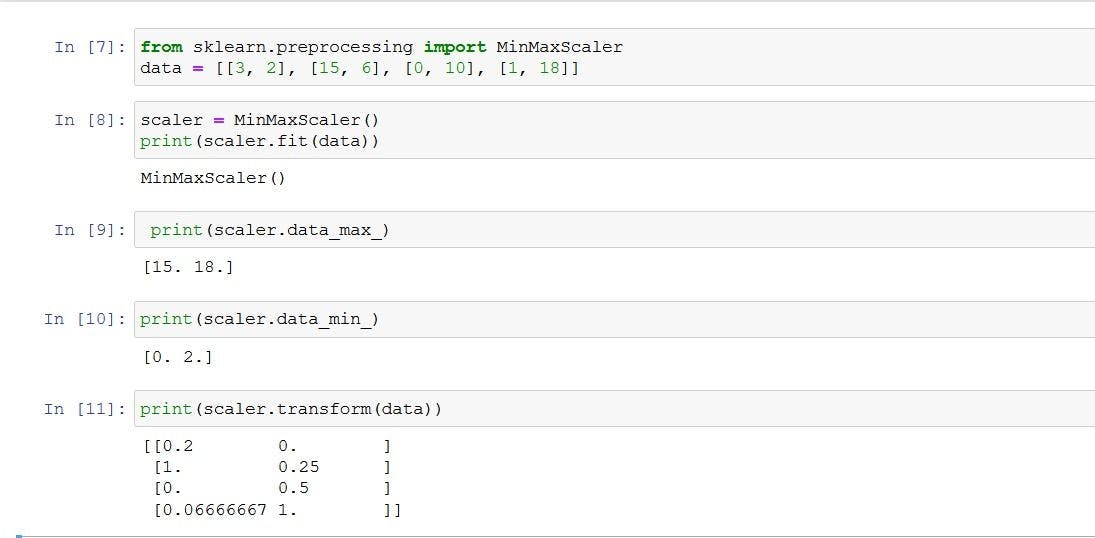
fit(X[, y]) : Compute the minimum and maximum to be used for later scaling.
transform(X): Scale features of X according to feature_range.
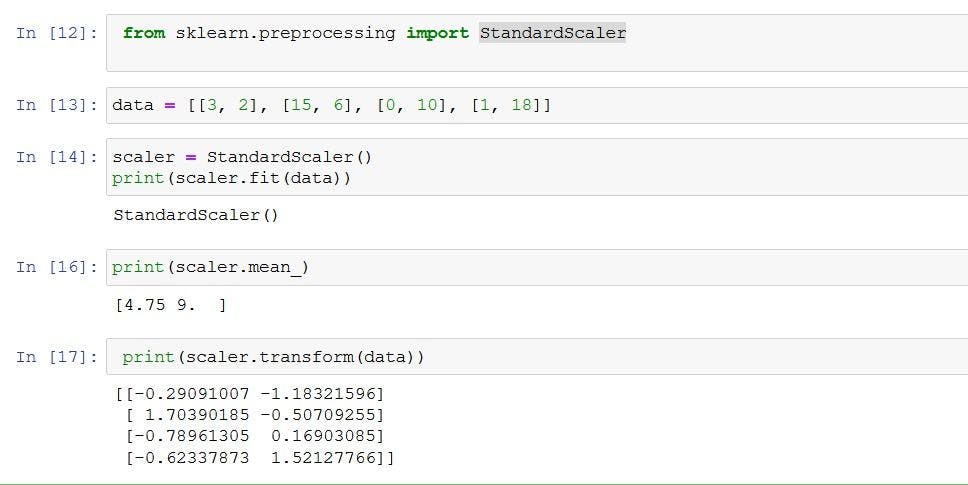
Z-score normalization
Also called standardization, z-score normalization sees features rescaled in a way that follows standard normal distribution property with μ=0 and σ=1, where μ is the mean (average) and σ is the standard deviation from the mean. The standard score or z-score of the samples are calculated using the following formula.
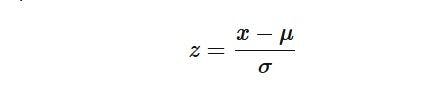
where x is a raw value, x' is the normalized value, u is the mean of the values, and sd is the standard deviation of the values.
For the three example values, u = (14+9+24+39+60) / 5 = 146/ 5 = 29.
The standard deviation of a set of values is the square root of the sum of the squared difference of each value and the mean, divided by the number of values.
sd = sqrt( [(14 - 29)^2 + (9 - 29)^2 + (24 - 29)^2 + (39 - 29)^2 + (60 - 29)^2] / 5 )
= sqrt( [(-15)^2 + (-20.0)^2 + (-5.0)^2+ (10.0)^2 + (31)^2] / 5 )
= sqrt( [225.0 + 400.0 + 25.0+100+961 ] / 5 )
= sqrt( 1711.0 / 5 )
= sqrt(342.0)
= 18.49
Therefore, the z-score normalized values are:
14: (14 - 29.0) / 18.49 = -0.811
9: (9 - 29.0) / 18.49 = +1.08
24: (24 - 29.0) / 18.49 = -0.27
39: (39 - 29.0) / 18.49 = +0.54
60: (60 - 29.0) / 18.49 = +1.72
A z-score normalized value that is positive corresponds to an x value that is greater than the mean value, while a z-score that is negative corresponds to an x value that is less than the mean.
Implementation:
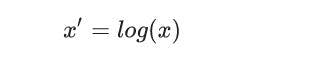
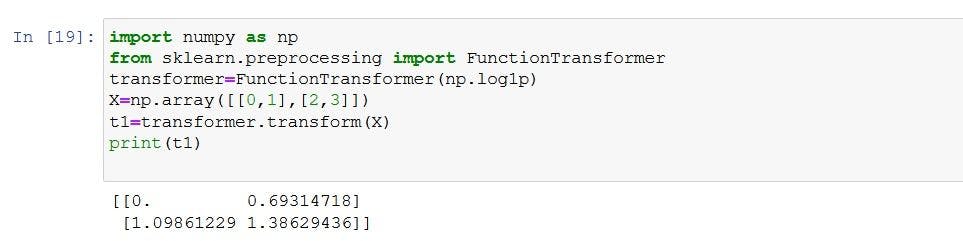
Log scaling
Log scaling computes the log of the values to compress a wide range to a narrow range. In other words, it helps convert a skewed distribution to a normal distribution/less-skewed distribution. To perform the scaling, take the log values in a column and use them as the column instead.
Formula:
Example:
14, 9, 24, 39, 60
14: log(14) =1.14
9: log(9) =0.95
24:log(24)=1.38
39:log(39)=1.59
60:log(60)=1.77
Min-max vs z-score vs log scaling
Min-max normalization is preferred when data doesn’t follow Gaussian or normal distribution. It’s favored for normalizing algorithms that don’t follow any distribution, such as KNN and neural networks. Note that normalization is affected by outliers.
On the other hand, standardization can be helpful in cases where data follows a Gaussian distribution. However, this doesn’t necessarily have to be true. In addition, unlike normalization, standardization doesn’t have a bounding range. This means that even if there are outliers in data, they won’t be affected by standardization.
Log scaling is preferable if a dataset holds huge outliers.
Many machine learning algorithms find an issue when features are on drastically different scales. Therefore, before implementing algorithms, it’s vital to convert features into the same scale. They can be rescaled based on the available dataset by using one of the normalization techniques covered in this article, namely, min-max, z-score, or log scaling.