K-Means Clustering: Managing Big Data in Python
•8 min read
- Languages, frameworks, tools, and trends

K-means clustering identifies clusters of data objects within a given data set using an unsupervised machine learning approach.
Essentially, this method categorizes untitled data into various clusters based on similarities and patterns.
There are various methods of data clustering, but because K-means clustering has been used for decades, it has also become the most approachable method making its implementation in Python relatively simple.
The simplicity of its usage also makes it perfect for beginners as well as seasoned data analysts.
In this article, we’ll be looking at various clustering techniques, implementing K-means clustering in Python with scikit-learn, knowing when to use it to analyze data, and how to get a meaningful cluster.
But, let’s start by first explaining what clustering is.
Clustering - what is it?
Clustering refers to various techniques used to segregate data into groups based on similarities.
To put it simply, data objects in certain clusters have more things in common with each other than data objects in other clusters.
Clustering is done to determine the usefulness and meaningfulness of the dataset.
For example, meaningful clustering makes it possible to understand how a particular vaccine affects various groups of people. Useful clustering, on the other hand, helps a YouTube channel understand which type of videos attract more viewers.
Since clustering has such massive implications for data analysis, it’s a must-have skill for anyone working extensively with datasets.
Now let’s look at some clustering techniques.
Clustering techniques
Clustering can be performed using a variety of techniques. In fact, there are quite a lot of techniques that can be used based on the requirements, and each of these techniques is categorized into distinct groups.
Since there are so many different techniques to choose from, it can be overwhelming trying to figure out which technique is best suited for the dataset you are working with.
The most popular techniques are:
- Partitional clustering,
- Density-based clustering,
- Hierarchical clustering.
Let’s take a look at these clustering techniques to understand which one works best with different datasets.
1. Partitional clustering
Partitional clustering is a technique that ensures none of the data objects are a part of more than a single cluster, while also making sure that every cluster has at least one data object.
Clusters are predetermined by the user while using this method, but the algorithms are nondeterministic. This means that every run of the data set could have various results even if the same dataset is used.
Partitional clustering generally works well when the clusters are in a spherical shape and it is also scalable based on the complexity of the algorithm.
However, this method isn’t very useful with clusters that form complex shapes or with differing densities.
Now let’s take a brief look at density-based clustering.
2. Density-based clustering
Clustering using the density-based method results in clusters of high-density data segregated by regions of low density.
Unlike partitional clustering, however, density-based clustering isn't predetermined by the user. Clusters are formed by a distance-based parameter that determines how close data points are to the provided parameters.
Density-based clustering is extremely good at determining clusters for non-spherical shapes and they are immune to outliers which can cause errors for other clustering methods.
But, this method isn’t suited for high-dimensional data like you would find in fields of medicine or paleography (study of old documents). It also might run into issues identifying clusters of differing densities.
Finally, let’s look at hierarchical clustering.
3. Hierarchical clustering
Hierarchical clustering, as the name suggests, segregates clusters based on a hierarchy that is predetermined by the user. There are two ways of implementing this hierarchy. Agglomerative clustering and Divisive clustering.
a. Agglomerative refers to the bottom-up concept that merges two of the most similar data points and repeats this process till all points have become a single cluster.
b. Divisive, on the other hand, starts as one cluster containing all the data points and then filters out the least similar clusters till there is only one data point left.
Using either of these methods will yield results in the form of a dendrogram (tree-based hierarchy), and similar to partitional clustering the number of clusters will be predetermined by the user.
Hierarchical clustering does an amazing job in exposing more information on the relationship between data objects and the dendrogram, which helps in understanding and interpreting the information much better.
Unlike density-based clustering, hierarchical clustering is completely prone to noise and outliers, and depending on the complexity of the algorithm, it can be expensive from a computational standpoint.
Now that we’ve briefly understood the methods of clustering, let’s get into how it works in Python.
What is the K-means algorithm?
Let’s start with a visualization of data points.
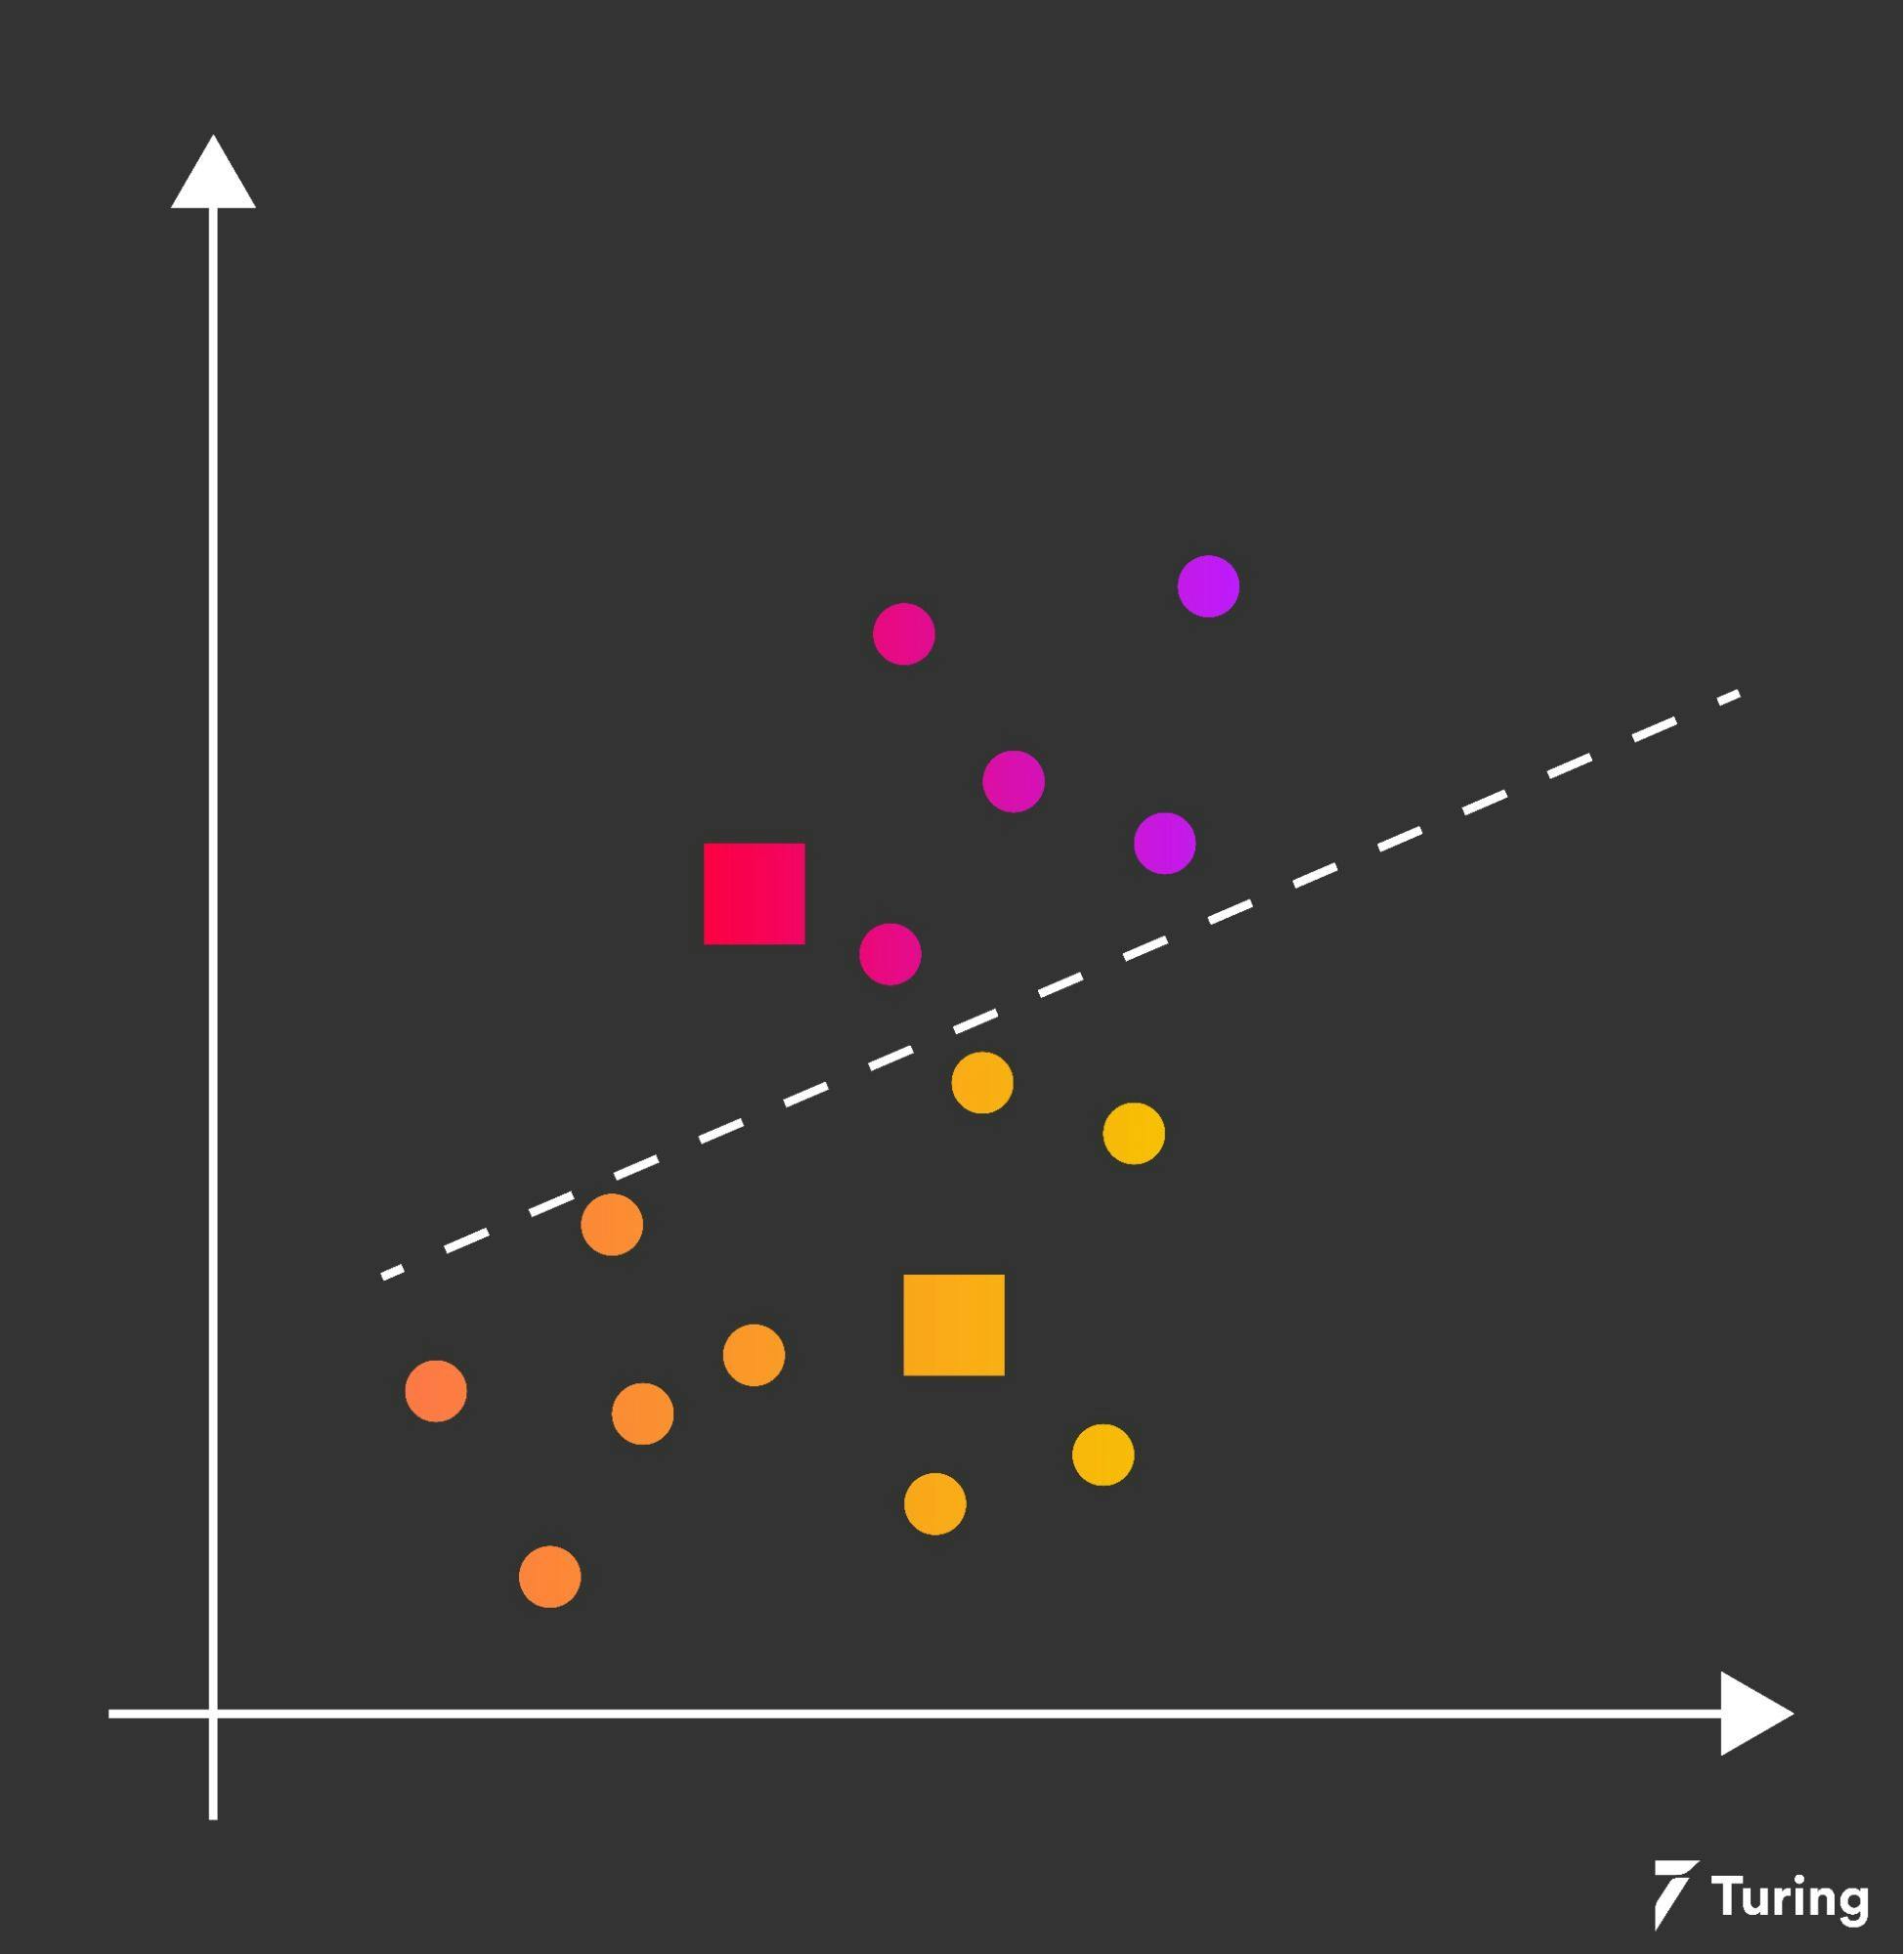
To understand the K-means algorithm, let's break it down into steps.
Step 1: The number K of clusters has to be assigned.
Step 2: The K centroids have to be initialized at random.
Step 3: Repeat the same process.
Once these steps are completed we have two processes to look at. Expectation and Maximization.
As the repetition process continues, the expectation is that each point is assigned to its nearest centroid, while the maximization computes the new centroid for every cluster.
This is done till none of the clusters have any changes in their centroid as shown in the image below.
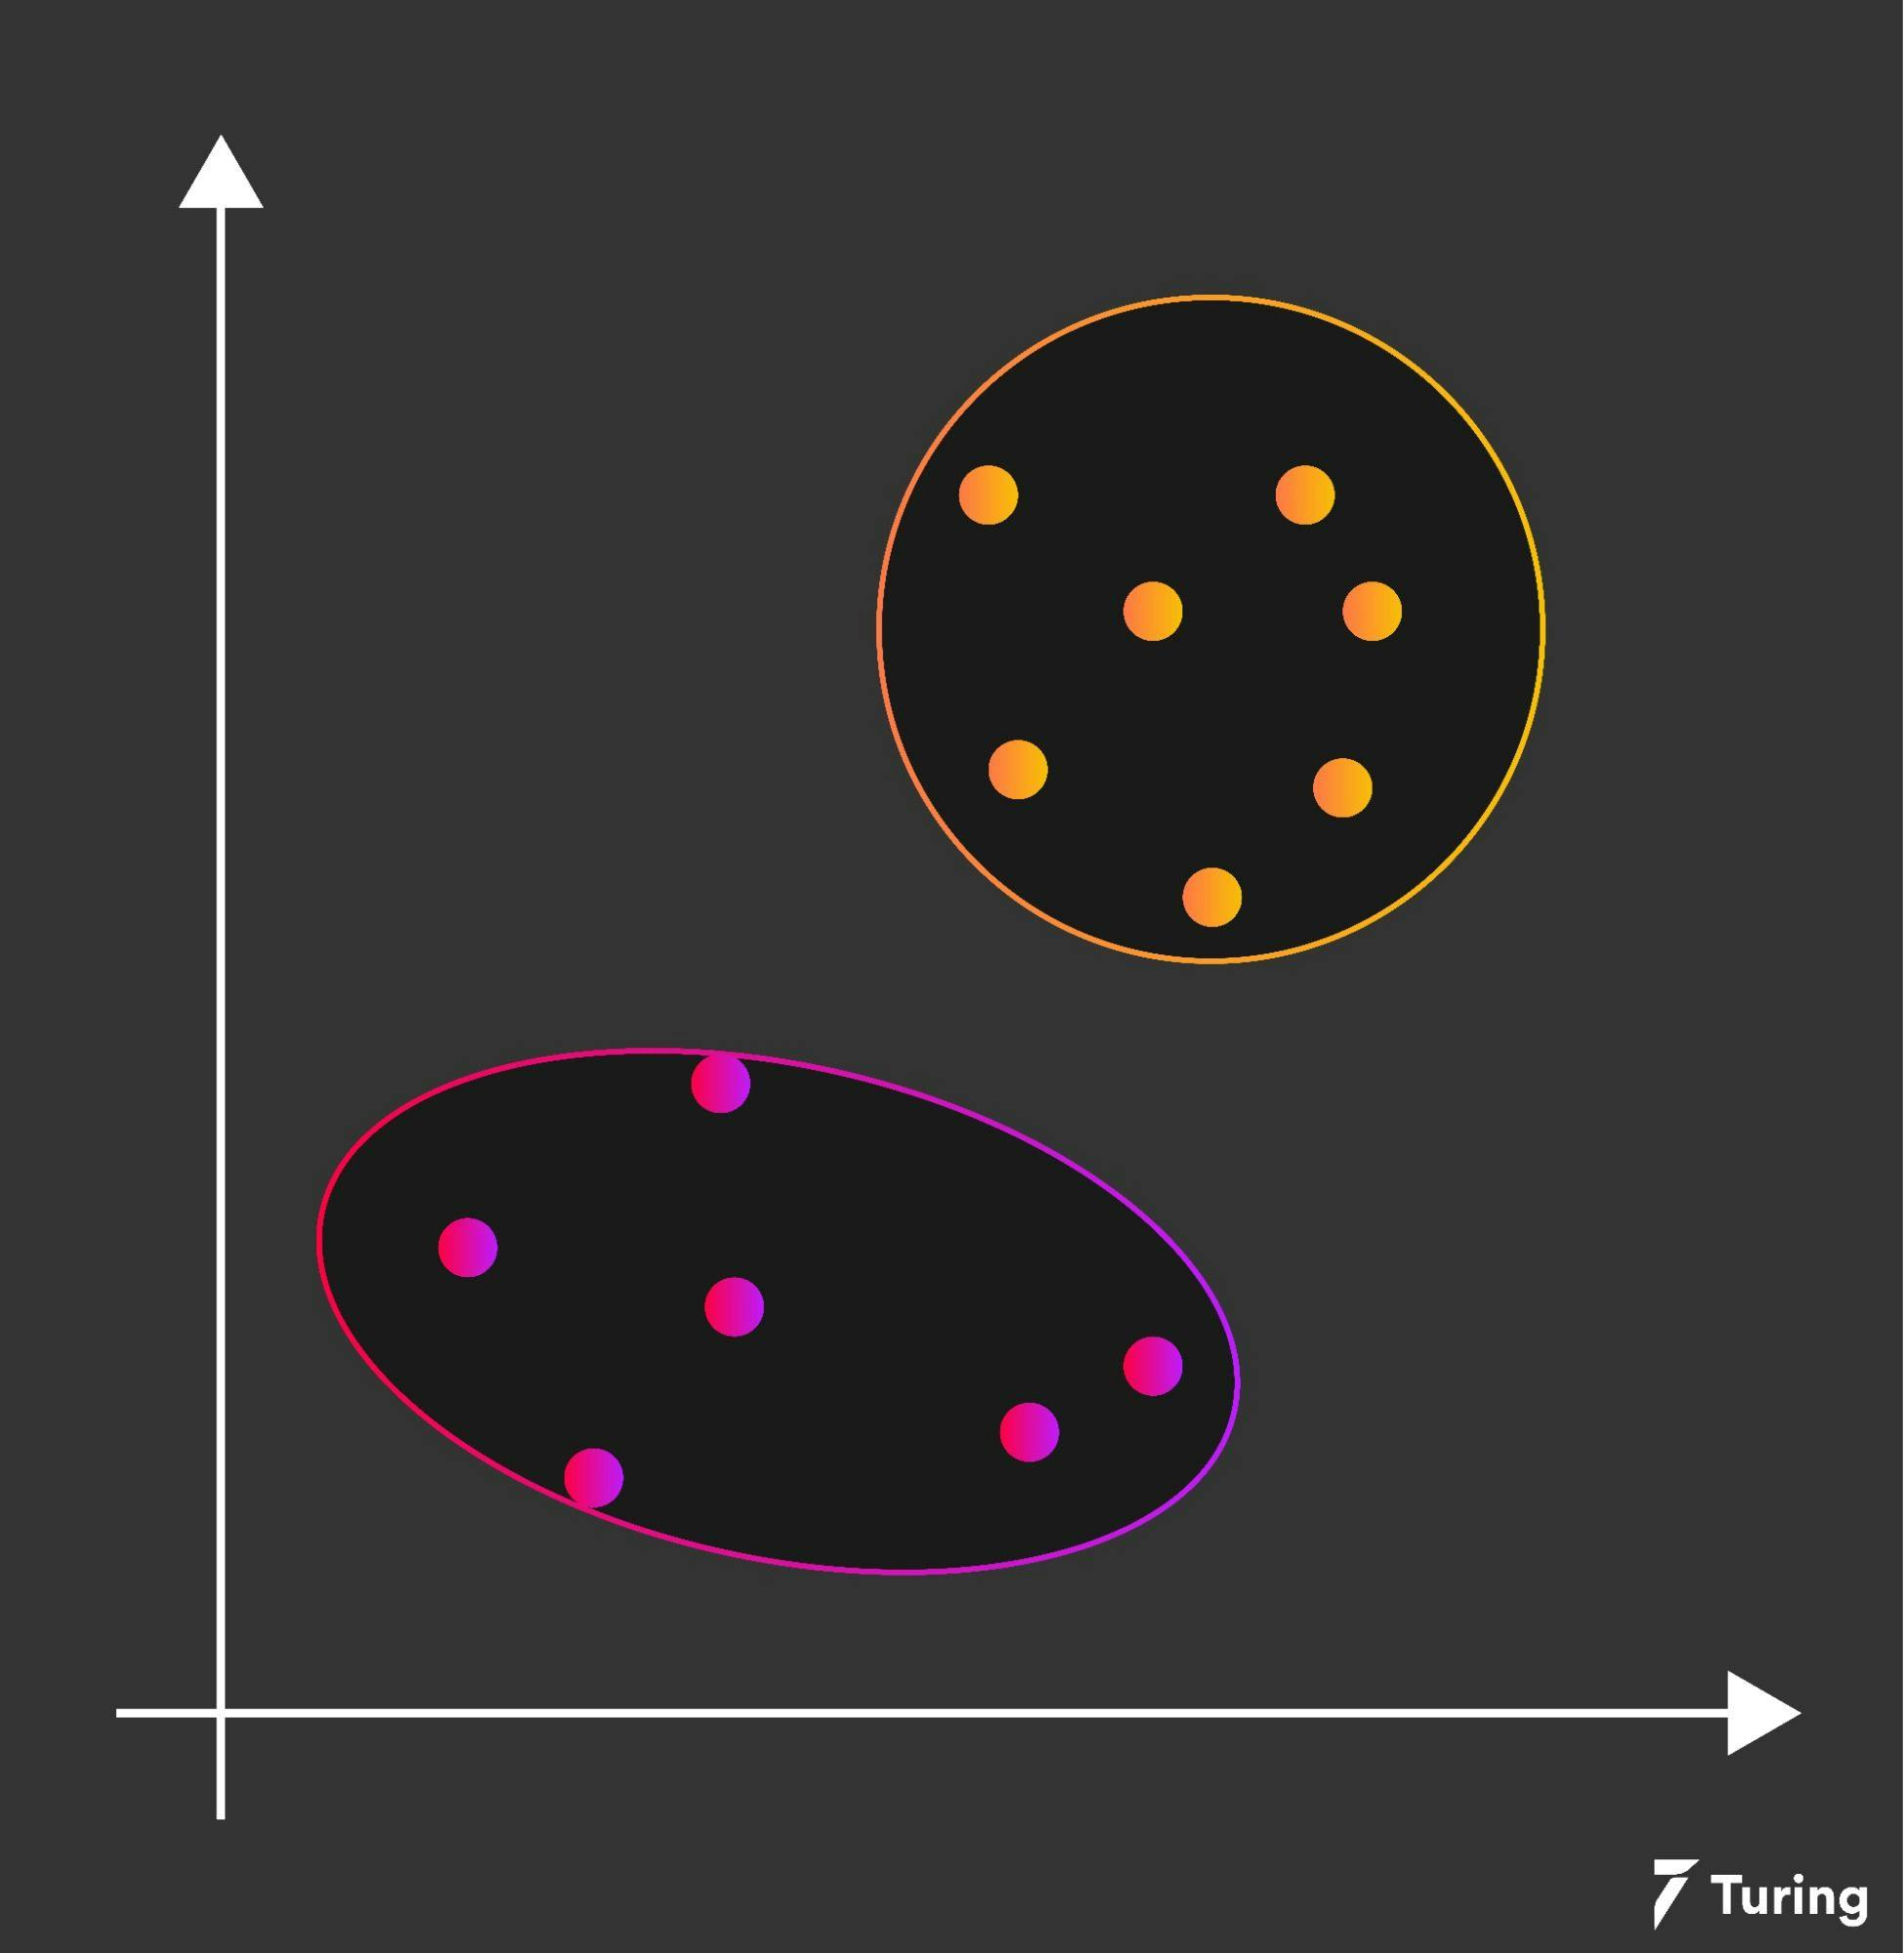
After the centroids have converged or matched, the previous assignments are iterated, and the quality of the assigned clusters is computed by the sum of the squared error (SSE). However, the reason for using the K-means algorithm is to minimize these errors.
Therefore, for an accurate result, several runs are performed using the K-means algorithm and selecting the clusters with the least SSE.
Now let’s take a look at how to manage data with K-means in Python.
Using the K-means algorithm in Python
Before we start, make sure you have Python installed on your computer along with Anaconda (to simplify package management and deployment). If you haven’t installed these components and programs, you can learn how to do it here.
Step 1: Start by installing the packages.
Begin with the following,
The code above will allow you to use an ipython console or Jupyter Notebook.
Step 2: Proceed to install the modules needed to run the code. In this case, you can create a 2D dataset with three blobs. The K-means algorithm will help scrutinize the results.
Use the code below to build a 2D dataset with three blobs.
Step 3: This code below will help visualize the data.
Step 4: Create a K-means object while implementing the following parameters.
- Number of clusters
- Train the model
- Estimation
Step 5: Next, you need to visualize and plot the cluster’s center with our K-means estimator in Python. And the code below will give you three data clusters from the data set you have provided.
Next, comes the implication of using the K-means algorithm. Let’s take a look.
Implications of K-means algorithm
Before we jump into the advantages and disadvantages of the K-means algorithm, let’s take a look at some of the applications.
K-means algorithm is widely used in medical research such as radiology and biological data. It can be used by businesses for market research as well as to understand customer distribution.
It can also be used in social network analysis, clustering search engine results, and pattern recognition which can provide valuable data to upscale certain businesses.
Next, let’s take a look at some of the advantages and disadvantages of using the K-means algorithm.
Advantages
- K-means clusters are relatively easy to understand and implement.
- It scales to large datasets and is faster than hierarchical clustering if there are many variables.
- K-means clusters can create clusters of various shapes and sizes.
- It is easily adaptable, which allows an instance’s cluster to be changed.
- With K-means, convergence of all data points is guaranteed.
Disadvantages
- The value of K can be difficult to estimate since it is a manual process.
- Scaling with multiple dimensions or rescaling the data will deliver acutely varying results.
- Complicated geometric shapes can cause great damage to the K-means algorithm.
- It is completely dependent on the initial values provided. This is fine for a small number of clusters but problematic for larger clusters.
- Outliers can start forming their own clusters as they aren’t always ignored by the algorithm, prompting inaccurate results.
The K-means clustering method is unsupervised, meaning that it does not require any labeled responses to inputs. This is generally what machine learning algorithms do, but there is a variable amount of supervision that is required, especially while considering your dataset.
This also ties into the fact that K-means generally works extremely well with spherical clusters, but falls apart when the cluster shapes become more complex.
Keeping this in mind, always be sure to analyze the assumptions and requirements of various algorithms as this helps you understand which technique or method is best suited for different datasets and analytical results.
FAQs
1. Can K-Means clustering handle big data?
While K-Means allows for clustering of data, and is scalable, it isn’t capable of handling large datasets by itself. K-Means can be used based on MapReduce to manage and manipulate large datasets.
2. What does K mean clustering mean?
K-means clustering identifies clusters of data objects within a given data set using an unsupervised machine learning approach. It bunches n number of observations into K clusters based on the nearest mean (centroid).
3. What is the main problem with the K-Means algorithm?
The main problem with K-Means clusters are when the shapes are complicated. K-means functions much better when shapes are geometric in nature. The more freeflowing the shape of clusters, the harder it is for K-Means to create them.